TY72011 查看數據表(PDF) - ON Semiconductor
零件编号
产品描述 (功能)
生产厂家
TY72011
ON Semiconductor

TY72011 Datasheet PDF : 13 Pages
| |||
TY72011AP2
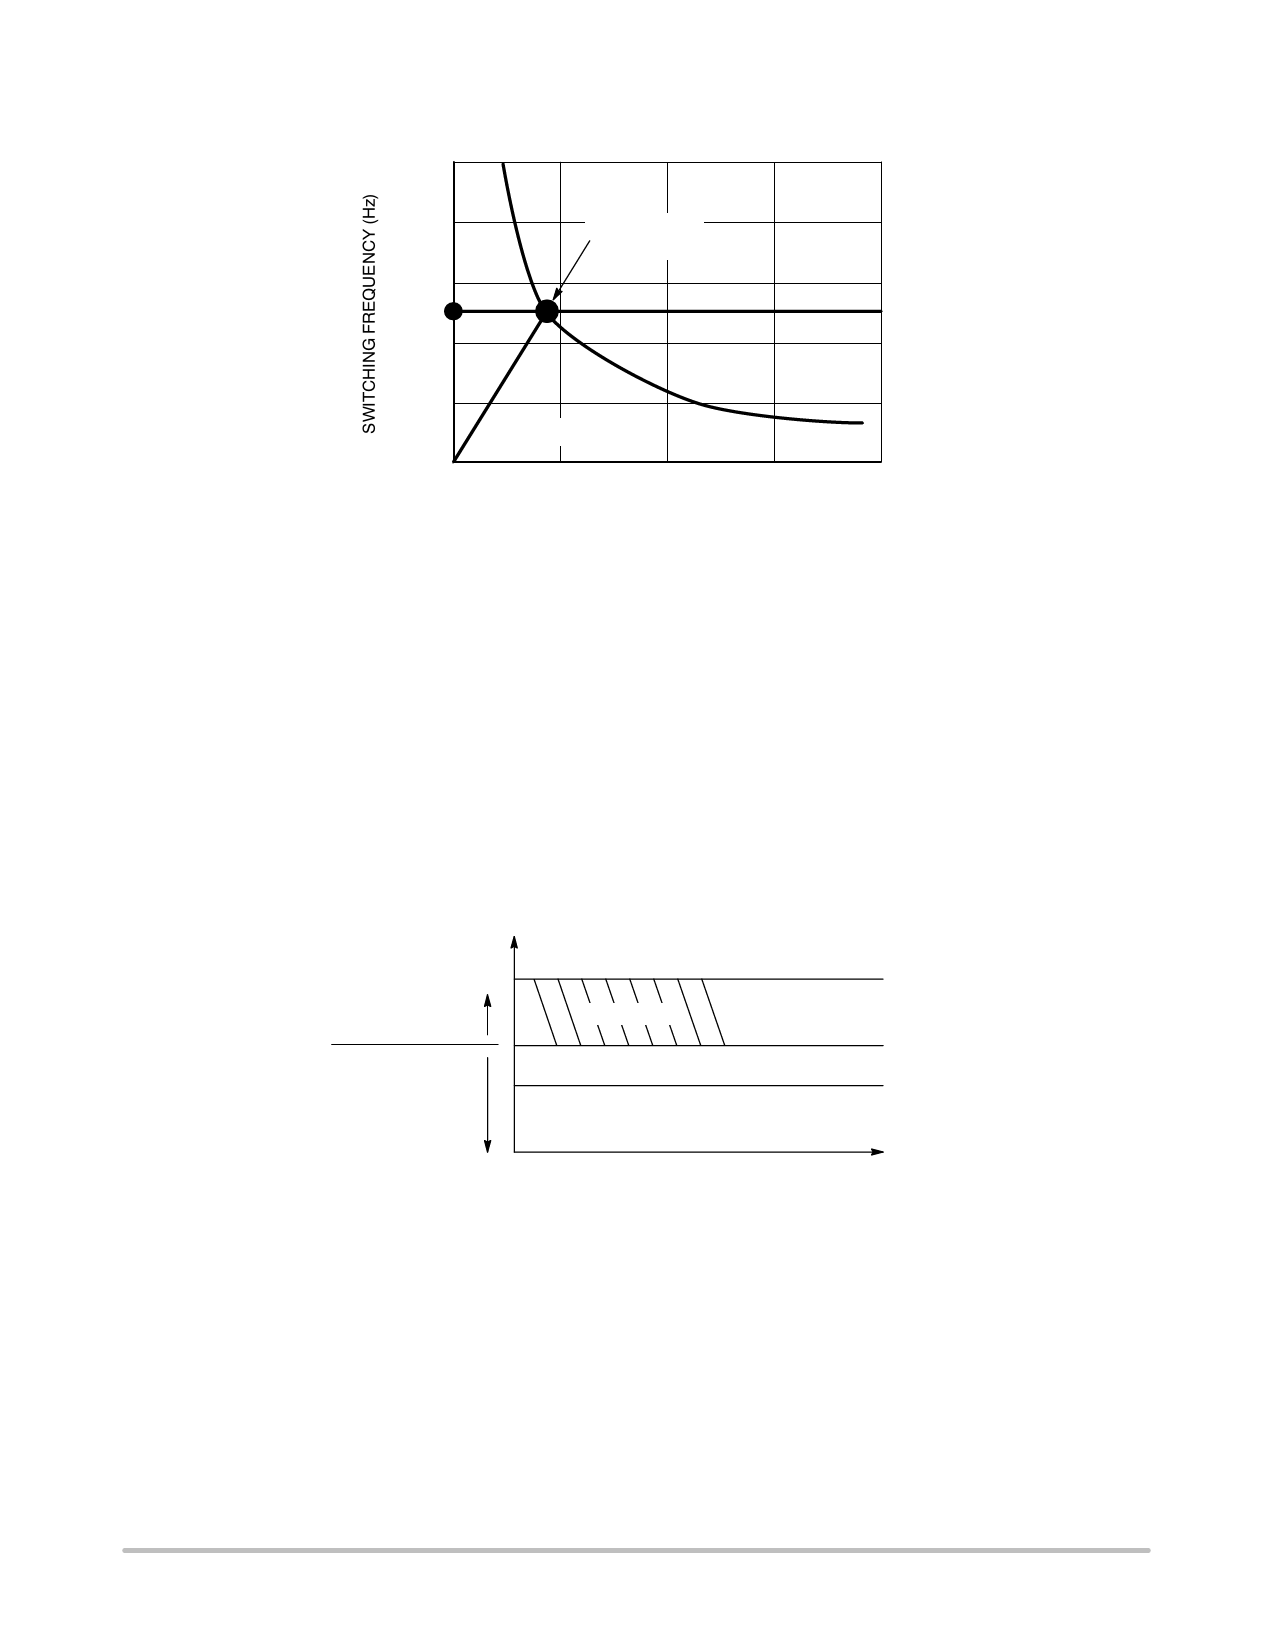
If we now enter this formula into a spreadsheet, we can easily plot the switching frequency versus the output power demand:
250000
200000
150000
Fmax
100000
Transition
BCM to VFM
Fmax
50000
VCO Action
0
0
5
10
15
20
OUTPUT POWER (W)
Figure 4. Free Running Frequency vs. Output Power
The typical above diagram shows how the frequency
moves with the output power demand. The components used
for the simulation were: Vin = 300 V, Lp = 6.5 mH,
Vout = 10 V, Np/Ns = 12.
The red line indicates where the maximum frequency is
clamped. At this time, the VCO takes over and decreases the
switching frequency to the minimum value.
VCO Operation
The VCO is controlled from the Verr voltage. For Verr
levels above 1.0 V, the VCO frequency remains unchanged
at 125 kHz. As soon as Verr starts to decrease below 1.0 V,
the VCO frequency decreases with a typical small-signal
slope of -175 kHz/mV @ Verr = 500 mV down to
zero (typically at FB ≈ 3.3 V). The demagnetization
synchronization is however kept when the Toff expands.
The maximum switching frequency can be altered by
adjusting the Ct capacitor on pin 5. The 125 kHz maximum
operation ensures that the fundamental component stays
external from the international EMI CISPR-22
specification beginning.
The following drawing explains the philosophy behind
the idea:
Internal Verr
VCO Frequency
is Fixed at 130 kHz
VCO Frequency
can Decrease
BCM Mode
Peak current
can change
Peak Current is Fixed
3V
1V
0.75 V
Figure 5.
http://onsemi.com
8
Free Datasheet http://www.datasheet-pdf.com/
Share Link: