ADT7475ARQZ-REEL жҹҘзңӢж•ёж“ҡиЎЁпјҲPDFпјү - ON Semiconductor
йӣ¶д»¶зј–еҸ·
дә§е“ҒжҸҸиҝ° (еҠҹиғҪ)
з”ҹдә§еҺӮ家
ADT7475ARQZ-REEL Datasheet PDF : 58 Pages
| |||
ADT7475
TYPICAL PERFORMANCE CHARACTERISTICS
0
вҖ“10
вҖ“20
вҖ“30
вҖ“40
вҖ“50
вҖ“60
0 2 4 6 8 10 12 14 16 18 20 22
CAPACITANCE (nF)
Figure 3. Temperature Error vs. Capacitance
Between D+ and DвҲ’
30
20
10
D+ to GND
0
D+ to VCC
вҖ“10
вҖ“20
вҖ“30
вҖ“40
0
20
40
60
80
100
LEAKAGE RESISTANCE (MW)
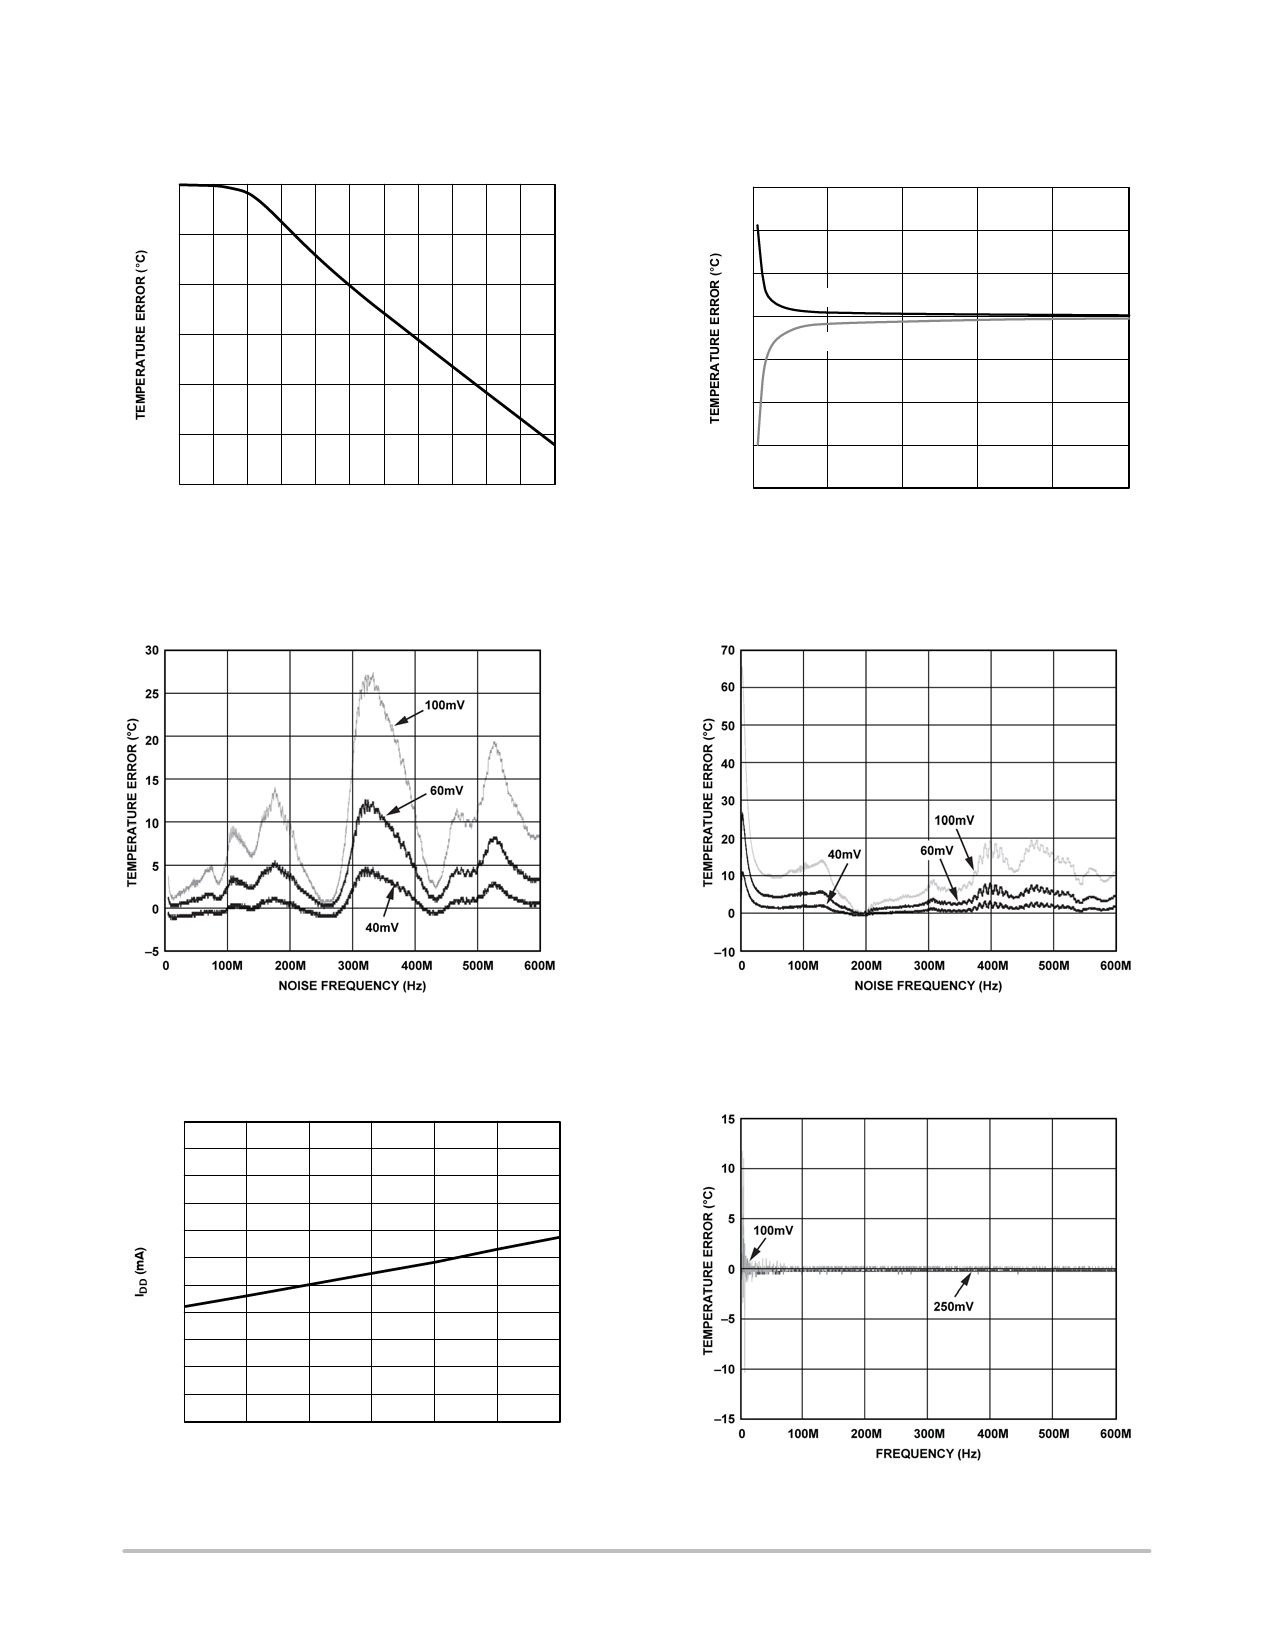
Figure 4. Remote Temperature Error vs. PCB
Resistance
Figure 5. Remote Temperature Error vs.
CommonвҲ’Mode Noise Frequency
Figure 6. Remote Temperature Error vs.
Differential Mode Noise Frequency
1.20
1.18
1.16
1.14
1.12
1.10
1.08
1.06
1.04
1.02
1.00
0.98
3.0
3.1
3.2
3.3
3.4
VDD (V)
3.5
3.6
Figure
7.
Normal
IDD B
B
vs.
Power
Supply
Figure 8. Internal Temperature Error vs. Power
Supply Noise
http://onsemi.com
6
Share Link: 