ADC-207MM-QL 查看數據表(PDF) - DATEL Data Acquisition products
零件编号
产品描述 (功能)
生产厂家
ADC-207MM-QL Datasheet PDF : 6 Pages
| |||
ADC-207
CLOCK IN
GROUND
+5 VOLTS
9
4
5
0.01µF
8
6
20k
1
2
10pF
®
®
13
11
12
CLOCK OUT
3
to 12ns to improve performance above
20MHz. Such a configuration will closely
resemble an ideal sampler.
Figure 3. Optional Pulse Shaping Circuit
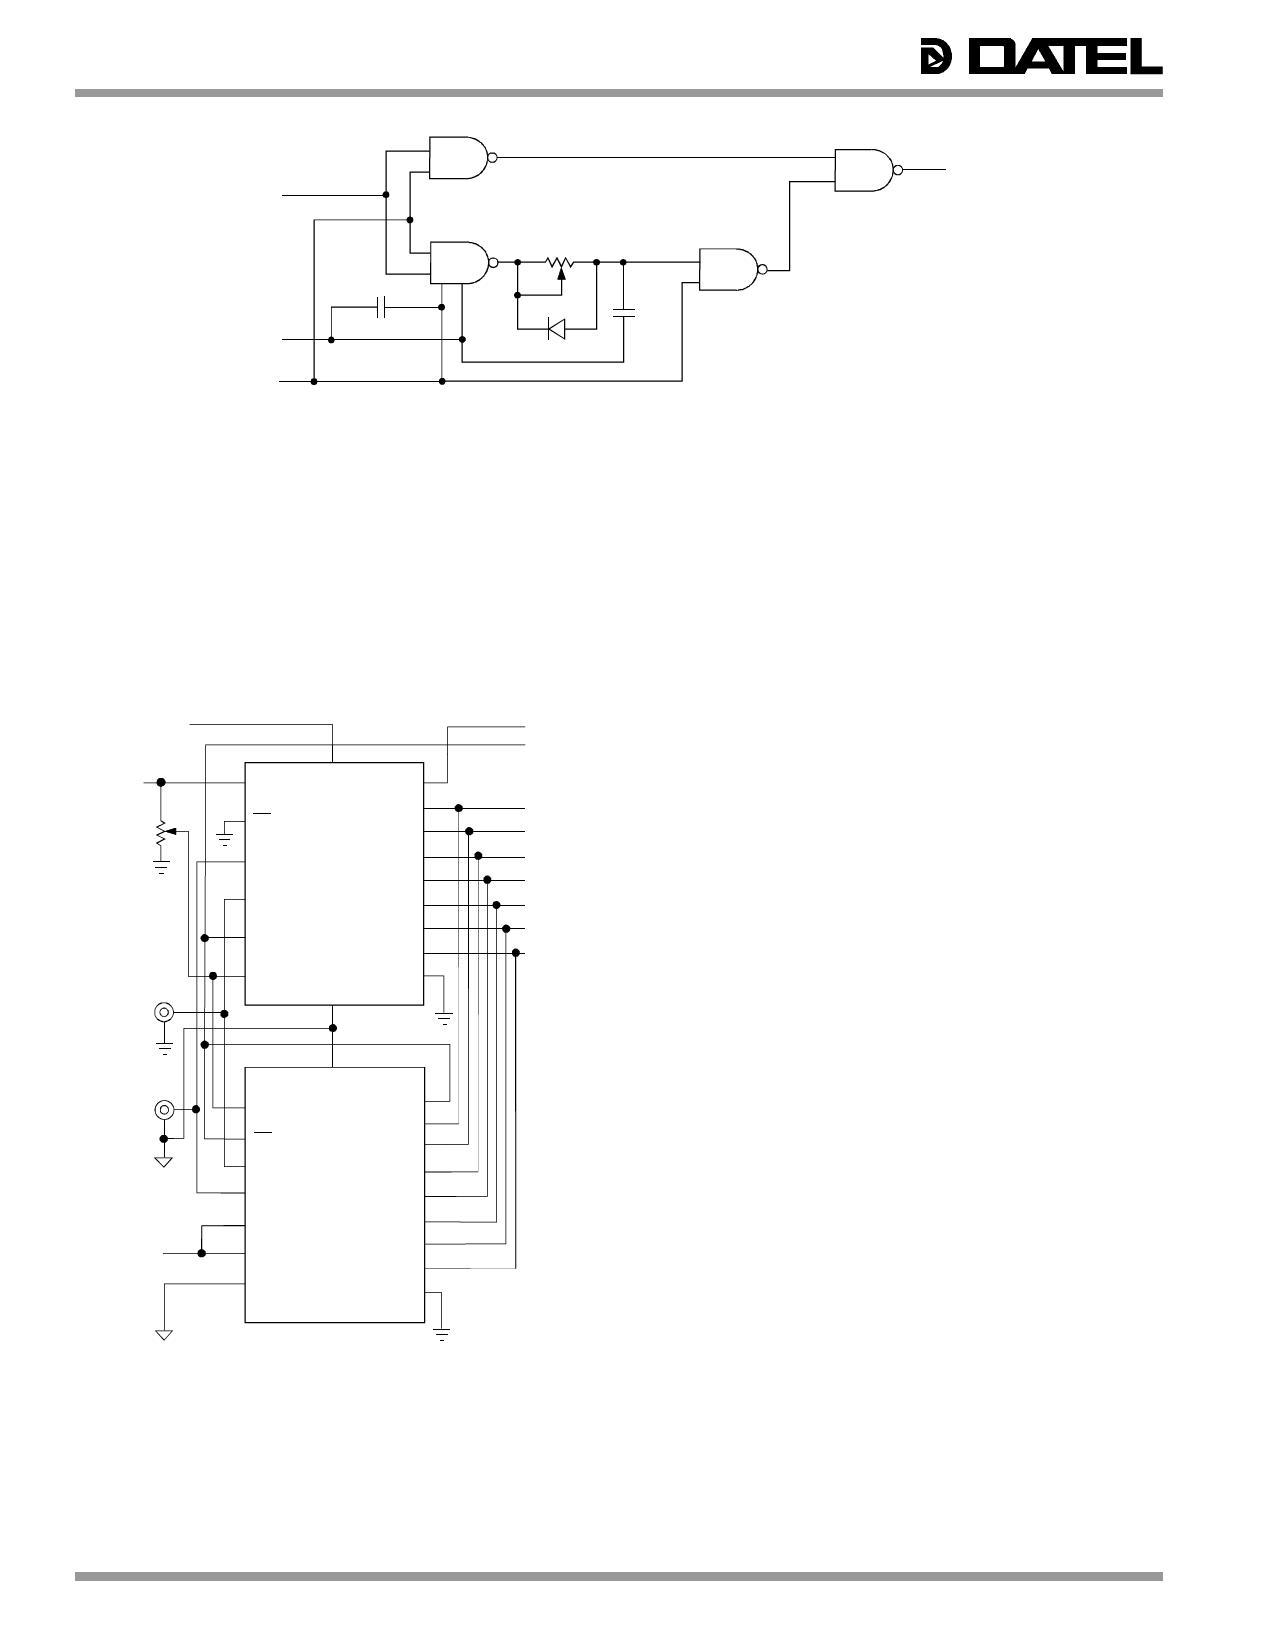
USING TWO ADC-207’S FOR 8-BIT RESOLUTION
Two ADC-207’s (A and B) are cascadable for applications
requiring 8-bit resolution. The device A provides a typical 7-bit
output. The OVERFLOW signal of device A turns off device A
and turns on the device B. The OVERFLOW signal of device A
is also used as MSB for 8-bit operation. The device B provides
the other seven bits from the input signal. Figure 4 shows the
circuit connections for the application.
+5V
+5.12
REFERENCE
IN
10
TURN
OPTIONAL
MIDSCALE
ADJUST
CLOCK IN
18
6
+VDD
+REFERENCE
8
CS1
4
ANALOG INPUT
1
CLOCK
9
CS2
3
–REFERENCE
10
OF
11
B1
12
B2
B3 13
14
B4
B5 15
16
B6
17
B7
2
DIG GND
ANALOG GROUND
7
ANALOG IN
+5V
7
ANALOG GROUND
6 +REFERENCE
8
CS1
1 CLOCK
4 ANALOG INPUT
10
OF
11
B1
12
B2
13
B3
14
B4
9 CS2
18 +VDD
3 –REFERENCE
15
B5
16
B6
17
B7
2
DIG GND
OVERFLOW
BIT 1 (MSB)
BIT2
BIT3
BIT4
BIT5
BIT6
BIT7
BIT8 (LSB)
BEAT FREQUENCY AND ENVELOPE TESTS
Figure 5 shows an actual ADC-207 plot of the Beat Frequency
Test. This test uses a 20MHz clock input to the ADC-207 with
a 20.002MHz full-scale sine wave input. Although the
converter would not normally be used in this mode because
the input frequency violates Nyquist criteria for full recovery of
signal information, the test is an excellent demonstration of the
ADC-207’s high-frequency performance.
The effect of the 2kHz frequency difference between the input
and the clock is that the output will be a 2kHz sinusoidal digital
data array which "walks" along the actual input at the 2kHz
beat note frequency. Any inability to follow the 20.002MHz
input will be immediately obvious by plotting the digital data
array. Further arithmetic analysis may be done on the data
array to determine spectral purity, harmonic distortion, etc.
This test is an excellent indication of:
1. Full power input bandwidth of all 128 comparators.
(Any gain loss would show as signal distortion.)
2. Phase response linearity vs. instantaneous signal
magnitude. (Phase problems would show as
improper codes.)
3. Comparator slew rate limiting.
Figure 6 shows an actual ADC-207 plot of the Envelope Test.
This test is a variation of the previous test but uses a
10.002MHz sinewave input to give two overlapping cycles
when the data is reconstructed by a D/A converter output to an
oscilloscope. The scope is triggered by the 20MHz clock used
by the A/D. Any asymmetry between positive and negative
portions of the signal will be very obvious. This test is an
excellent indication of slew rate capability. At the peaks of the
envelope, consecutive samples swing completely through the
input voltage range.
REFERENCE
GROUND
NOTE: The output data bit numbering is offset
by a bit to the device B’s output.
Figure 4. Using Two ADC-207’s for 8-Bit Operation
Share Link: 